Live gauge · updated 2026-06-29
The Dimension Index
How much independent diversification the market is actually offering right now — and how close that structure sits to a fold collapse. The diversification analogue of VIX: VIX measures expected volatility; this measures structural diversification capacity.
Method: Bayesian discounted inverse-Wishart, 63-day half-life, daily log returns. The shaded band is the 90% posterior credible interval on the effective dimension.
The picture
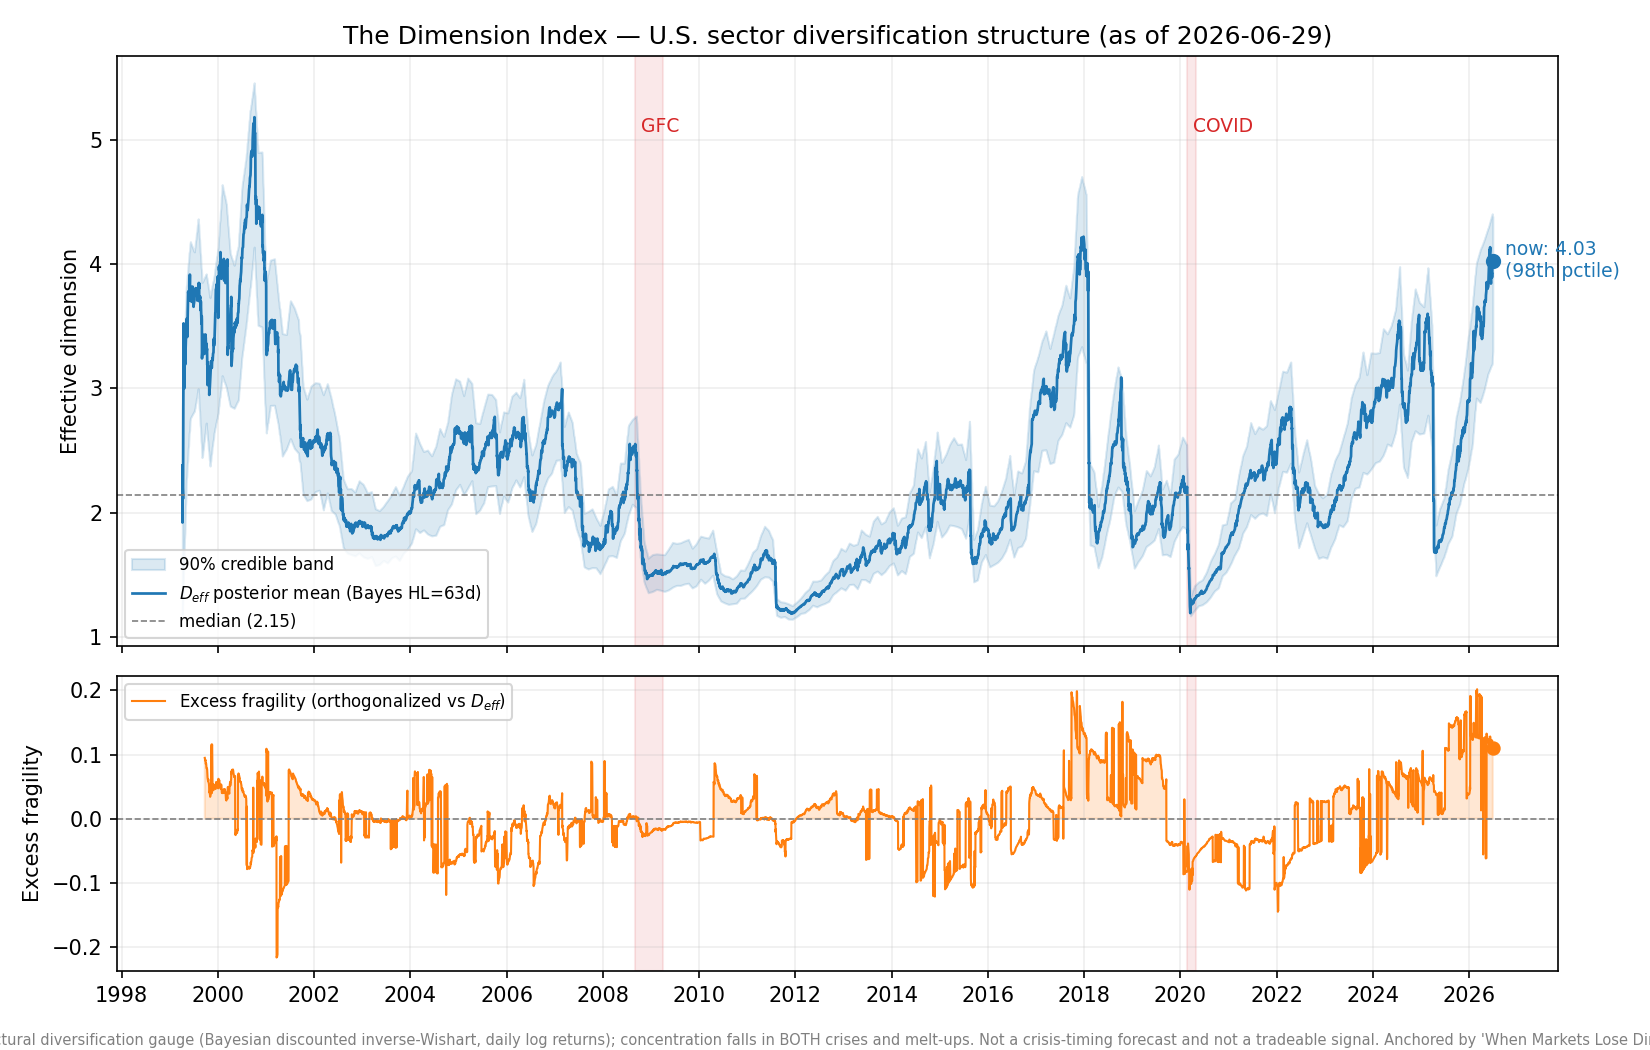
Where we stand
| Reference | Date | Effective dimension |
|---|---|---|
| Pre-GFC (calm) | 2007-06-29 | 2.14 |
| GFC trough | 2008-12-02 | 1.47 |
| Pre-COVID (calm) | 2020-01-17 | 2.26 |
| COVID trough | 2020-03-16 | 1.19 |
| Now | 2026-06-29 | 4.03 |
What this is — and is not
Is a direction-agnostic structural diversification gauge — the level of concentration/fragility now vs its own history and vs pre-GFC / pre-COVID readings. Concentration rises in both crises (everything sells off together) and melt-ups (one theme drives everything), so the level measures structure, not direction. A separate fold orientation layer then signs the concentration (melt-up vs risk-off) from the dominant mode's drift — a coincident regime tag, not a forecast.
Is not a crisis-timing forecast (the timing test is null) and not a tradeable signal (the fold-factor is not investable). It does not name or claim persistence of the underlying factors — it reports the point-in-time effective number. It is a risk-monitoring instrument.
The proof
Anchored by the open research “When Markets Lose Dimensions: Foldability, Diversification Runs, and the Public Good of Risk Transfer” — with a 158-theorem proof domain formally verified in Lean 4. See the research →